graph omop hierarchy accepts output from either omop_ancestors(), omop_descendants() or omop_relations
Source:R/omop_graph.R
omop_graph.Rdgraph omop hierarchy accepts output from either omop_ancestors(), omop_descendants() or omop_relations
super short name graph func
Usage
omop_graph(
  dfin,
  ggrlayout = "graphopt",
  palettebrewer = "Dark2",
  palettedirection = 1,
  edgecolour = "grey71",
  nodecolourvar = "domain_id",
  textcolourvar = NULL,
  nodealpha = 0.8,
  edgealpha = 0.3,
  edgewidth = 0.1,
  nodesizevar = "connections",
  nodesize = c(0, 6),
  nodetxtvar = "name",
  nodetxtangle = 0,
  nodetxtsize = 9,
  nodetxtnudgey = 0.3,
  nodetxtnudgex = 0,
  legendtxtsize = 18,
  titletxtsize = 18,
  titlejust = "centre",
  legendshow = TRUE,
  legendpos = "bottom",
  legenddir = "horizontal",
  legendcm = 3,
  plot = TRUE,
  saveplot = TRUE,
  filetype = "pdf",
  filenameroot = "omop_graph",
  filenamecustom = NULL,
  filepath = file.path("..//omopcept-plots"),
  canvas = NULL,
  width = 50,
  height = 30,
  units = "cm",
  titlecolour = "darkred",
  backcolour = "white",
  graphtitle = "omopcept graph",
  graphsubtitle = NULL,
  caption = NULL,
  captiontxtsize = 18,
  captionjust = "left",
  captioncolour = "black",
  messages = TRUE
)

omgr(
  dfin,
  ggrlayout = "graphopt",
  palettebrewer = "Dark2",
  palettedirection = 1,
  edgecolour = "grey71",
  nodecolourvar = "domain_id",
  textcolourvar = NULL,
  nodealpha = 0.8,
  edgealpha = 0.3,
  edgewidth = 0.1,
  nodesizevar = "connections",
  nodesize = c(0, 6),
  nodetxtvar = "name",
  nodetxtangle = 0,
  nodetxtsize = 9,
  nodetxtnudgey = 0.3,
  nodetxtnudgex = 0,
  legendtxtsize = 18,
  titletxtsize = 18,
  titlejust = "centre",
  legendshow = TRUE,
  legendpos = "bottom",
  legenddir = "horizontal",
  legendcm = 3,
  plot = TRUE,
  saveplot = TRUE,
  filetype = "pdf",
  filenameroot = "omop_graph",
  filenamecustom = NULL,
  filepath = file.path("..//omopcept-plots"),
  canvas = NULL,
  width = 50,
  height = 30,
  units = "cm",
  titlecolour = "darkred",
  backcolour = "white",
  graphtitle = "omopcept graph",
  graphsubtitle = NULL,
  caption = NULL,
  captiontxtsize = 18,
  captionjust = "left",
  captioncolour = "black",
  messages = TRUE
)
Arguments
- dfin
dataframe output from either omop_ancestors(), omop_descendants() or omop_relations
- ggrlayout
ggraph layout, default = "graphopt", also "tree" works well, more directional
- palettebrewer
colour brewer palette, default='Dark2', other options e.g. 'Set1' see RColorBrewer::brewer.pal.info
- palettedirection
palette direction, default=1, -1 for reversed
- edgecolour
colour for lines joining nodes
- nodecolourvar
column to specify node colour, default="domain_id" other options "vocabulary_id" "concept_class_id" "standard_concept"
- textcolourvar
column to specify node text colour, default=NULL then set same as node_colour above. Other options "vocabulary_id" "concept_class_id" "standard_concept"
- nodealpha
node transparency, default 0.8
- edgealpha
edge transparency, default 0.3, #ggraph uses underscore edge_alpha but would mess up my consistency
- edgewidth
edge width, default 0.1, #ggraph uses underscore edge_width but would mess up my consistency
- nodesizevar
column to set node size, default="connections", uses num connections to a node
- nodesize
modify node size range, default c(0,6), will modify size whether nodesizevar used or not, single value e.g. 5 will give equal sized nodes
- nodetxtvar
column to set node label, default="name"
- nodetxtangle
node text angle, default=0, 90 gives vertical text
- nodetxtsize
node text size, default=9
- nodetxtnudgey
nudge_y text relative to points, default 0.3
- nodetxtnudgex
nudge_x text relative to points, default 0
- legendtxtsize
text size for legend, default=20
- titletxtsize
text size for title, default=20
- titlejust
title justification, "left","right", default "centre"
- legendshow
whether to show legend, default TRUE
- legendpos
legend position, default 'bottom'
- legenddir
legen direction default = 'horizontal'
- legendcm
legend size cm, default=3
- plot
whether to display plot, default TRUE, note that large plots will not display well in R graphics window but do output well to pdf
- saveplot
whether to save plot, default TRUE, note that large plots will not display well in R graphics window but do output well to pdf
- filetype
output image file, default='pdf'
- filenameroot
optional root for an auto filename for plot (not used if filenamecustom is supplied)
- filenamecustom
optional filename for plot, otherwise default name is created
- filepath
where to save image file, default=file.path("..//omopcept-plots")
- canvas
some plot setups that override width,height,units "A4" "A4landscape" etc.
- width
plot width, default=50
- height
plot height, default=30
- units
plot size units default='cm'
- titlecolour
colour for main title, default='darkred'
- backcolour
colour for background
- graphtitle
optional title for graph, default NULL for none
- graphsubtitle
optional subtitle for graph, default NULL for none
- caption
optional text below plot, default=NULL
- captiontxtsize
caption text size default=18,
- captionjust
caption justification default="left",
- captioncolour
caption text colour default="black",
- messages
whether to print info messages, default=TRUE
Examples
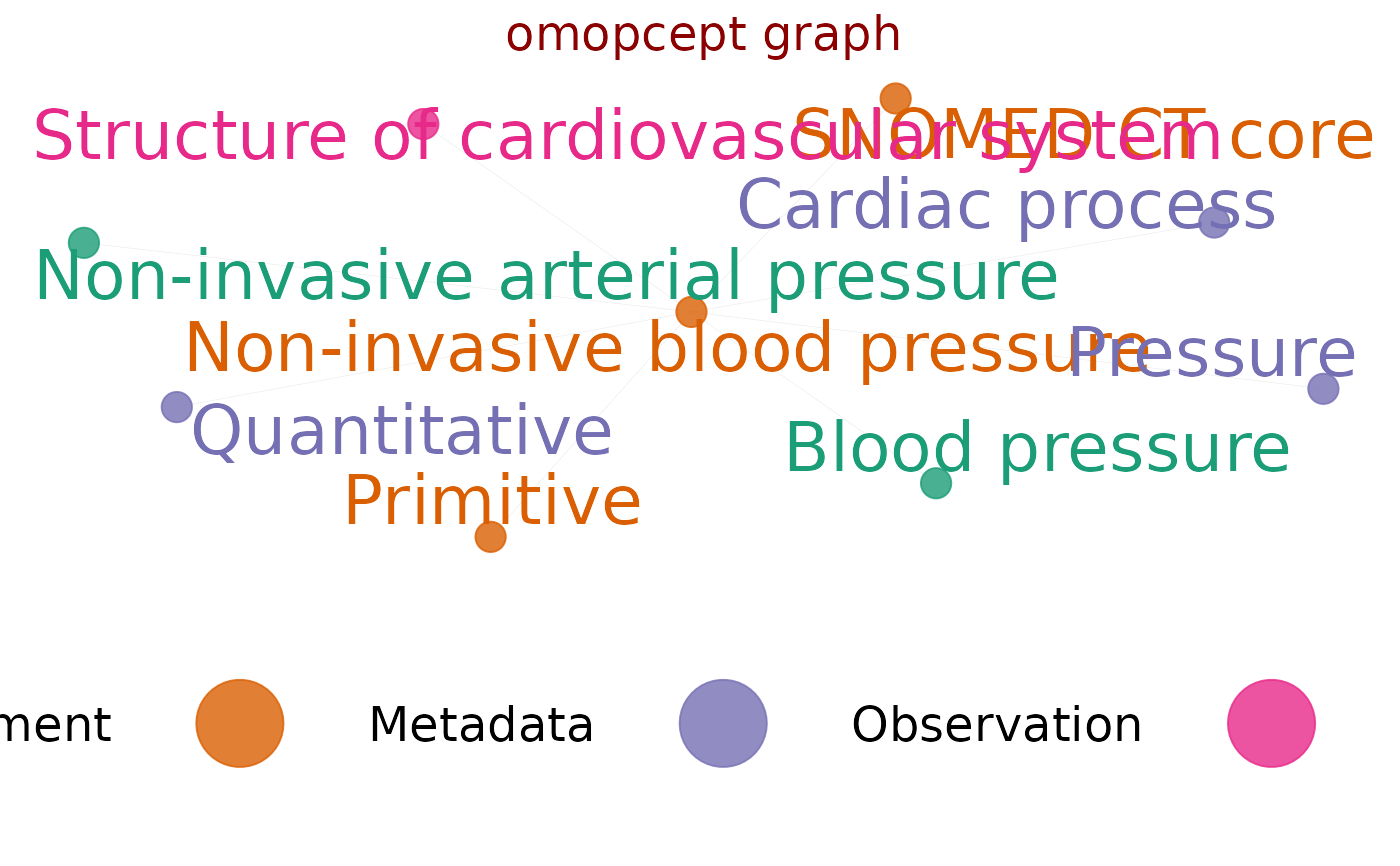
bp <- omop_relations("Non-invasive blood pressure")
#> recursively querying concept relations of: Non-invasive blood pressure - may take more than a few seconds
#> step 1 of 1
#> querying concept relations of: Non-invasive blood pressure - may take a few seconds
#> returning 8 concepts
omop_graph(bp, nodesizevar="connections", nodesize = 5)
#> plot dims: w 50 h 30 u: cm
#> saved graph file as omop_graph-graphopt-p1Dark2-legbottom3-nts9-nta0-ndomain_id-bwhite-egrey71-50x30cm.pdf
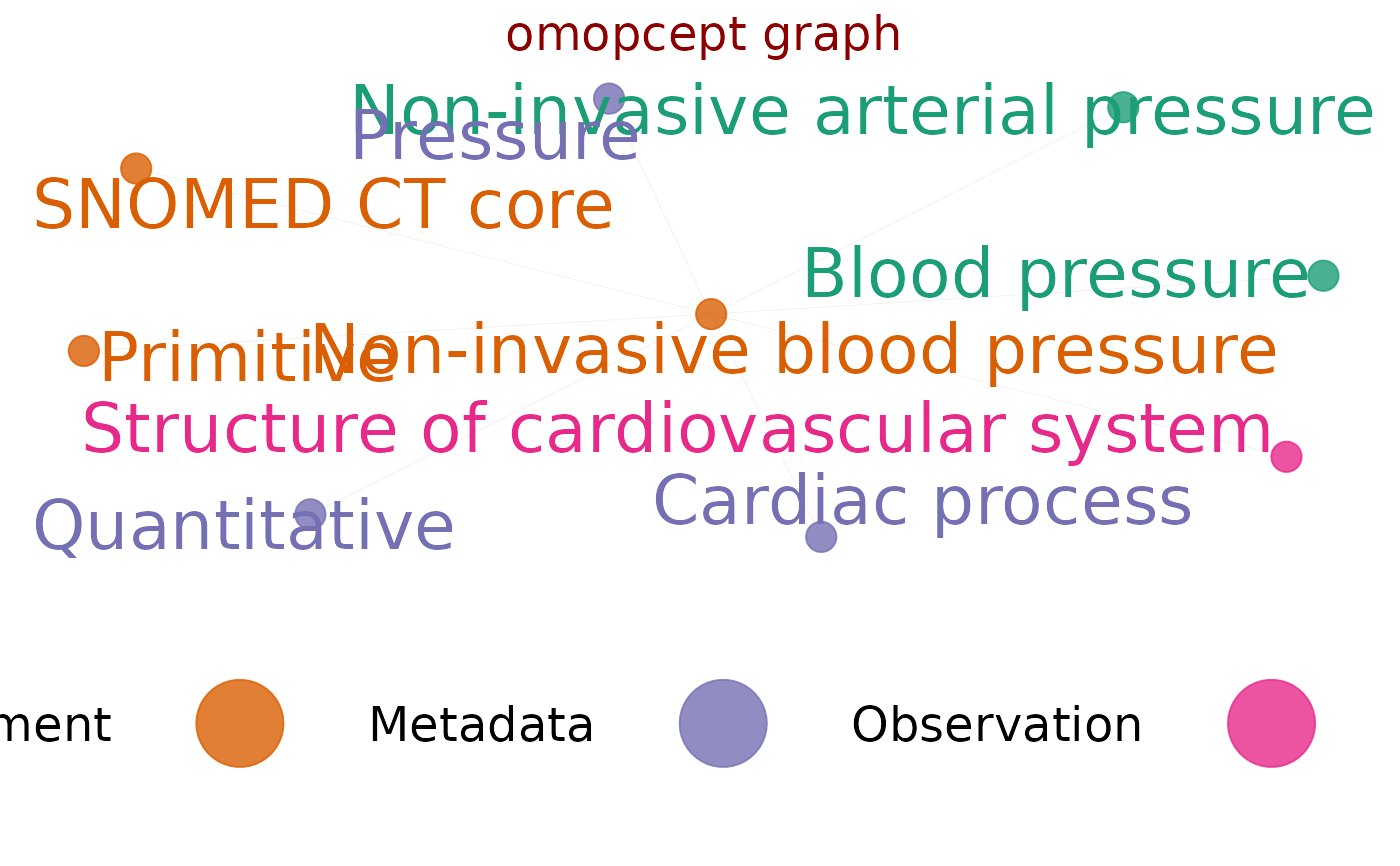
 omop_graph(bp, nodesizevar="", nodesize = 5)
#> plot dims: w 50 h 30 u: cm
#> saved graph file as omop_graph-graphopt-p1Dark2-legbottom3-nts9-nta0-ndomain_id-bwhite-egrey71-50x30cm.pdf
omop_graph(bp, nodesizevar="", nodesize = 5)
#> plot dims: w 50 h 30 u: cm
#> saved graph file as omop_graph-graphopt-p1Dark2-legbottom3-nts9-nta0-ndomain_id-bwhite-egrey71-50x30cm.pdf
 #TODO need a more flexible palette solution than brewer (that limits num cats)